Market Basket Analysis Using Apriori algorithm in python
Market Basket Analysis is one of the key techniques used by large retailers to uncover associations between items. It works by looking for combinations of items that occur together frequently in transactions. To put it another way, it allows retailers to identify relationships between the items that people buy.
Association Rules are widely used to analyze retail basket or transaction data, and are intended to identify strong rules discovered in transaction data using measures of interestingness
Association rules
The Apriori algorithm generates association rules for a given data set. An association rule implies that if an item A occurs, then item B also occurs with a certain probability. Let’s see an example,

In the table above we can see seven transactions from a clothing store. Each transaction shows items bought in that transaction. We can represent our items as an item set as follows:

In our case it corresponds to:

A transaction is represented by the following expression:

For example,

Then, an association rule is defined as an implication of the form:

For example,

In the following sections we are going to define four metrics to measure the precision of a rule.
Support
Support is an indication of how frequently the item set appears in the data set.

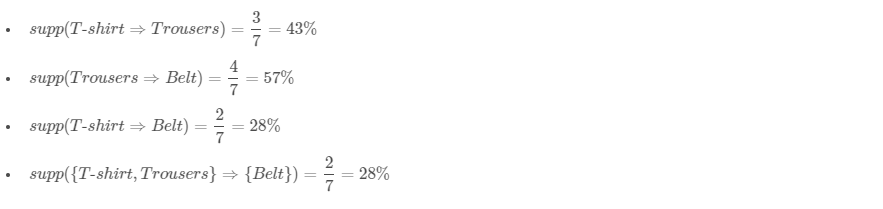
In other words, it’s the number of transactions with both X and Y divided by the total number of transactions. The rules are not useful for low support values. Let’s see different examples using the clothing store transactions from the previous table.
Confidence
import numpy as np import pandas as pd import seaborn as snsimport matplotlib.pyplot as pltfrom mlxtend.frequent_patterns import apriori, association_rules
STEP 1:read the csv file into a dataframe. Get the shape
file = "C:\\Users\\USER\\Documents\\A Python\\internship\\Machine-Learning-with-R-datasets-master\\Machine-Learning-with-R-datasets-master\\groceries.csv"file_delimiter = ','
largest_column_count = 0with open(file, 'r') as temp_f:
largest_column_count = [ len(l.split(file_delimiter)) for l in temp_f.readlines() ]
column_names = [i for i in range(0, max(largest_column_count))]
df = pd.read_csv(file, header=None, delimiter=file_delimiter, names=column_names)
df.shape
(9835,32)
df_unpivot=pd.melt(df.reset_index(),id_vars='index',var_name="item_num", value_name='item_name')
df_unpivot.rename(columns={'index': 'transaction_no'}, inplace=True)
df_unpivot.dropna(subset = ["item_name"], inplace=True)
df_unpivot.loc[df_unpivot['transaction_no']==1]

STEP 2 & 3:
df_top=pd.concat([df_unpivot["item_name"].value_counts(), df_unpivot["item_name"].value_counts(normalize=True)],keys=['item_name','item_count', 'item_perc'], axis=1)
df_top.head(20)

STEP 4:
def prune_dataset(input_df, length_trans, total_sales_perc): df_unpivoted = pd.melt(input_df.reset_index(), id_vars='index', var_name="item_num", value_name='item_name') df_unpivoted.rename(columns={'index': 'transaction_no'}, inplace=True) df_percent = pd.concat([df_unpivoted["item_name"].value_counts(), df_unpivoted["item_name"].value_counts(normalize=True)], keys=['counts', 'percent'], axis=1) df_percent['cumulative_percent']=df_percent['percent'].cumsum() col_arr = df_percent.loc[df_percent['cumulative_percent'].round(2)<=total_sales_perc].index.values df_pruned = (df_unpivoted.groupby(['transaction_no','item_name'])['item_name'] .count().unstack().reset_index().fillna(0) .set_index('transaction_no')) df_pruned = df_pruned.astype('int64') df_pruned = df_pruned[df_pruned.sum(axis=1) >= length_trans] df_pruned = df_pruned.loc[:,col_arr] return df_pruned
STEP 5:
df_apriori = prune_dataset(df, 2, 50)
frq_items = apriori(df_apriori, min_support = 0.04, use_colnames = True)
rules = association_rules(frq_items, metric ="lift", min_threshold = 1)
rules = rules.sort_values(['confidence', 'lift'], ascending =[False, False])
rules.loc[:,['consequents', 'antecedents', 'support', 'confidence', 'lift']].head(5)

"I am thankful to mentors at suven consultants for providing awesome problem statements and giving many of us a Coding Internship Exprience. Thank you Rocky Jagtiani"
df_top=pd.concat([df_unpivot["item_name"].value_counts(), df_unpivot["item_name"].value_counts(normalize=True)],keys=['item_name','item_count', 'item_perc'], axis=1) df_top.head(20)
STEP 4:
Comments
Post a Comment